 end;
end;
 end.
end.
 Marian Petre   Igor Netesin
 Blaine Price  Sergey Yershov    Vikki Fix    Jean Scholtz  Susan Widenbeck
Open University   TECHNOSOFT   U. of S. Dakota     Intel      U. of Nebraska
       UK          Ukrainia          USA            USA            USA
Contact Author: Blaine Price (B.A.Price@open.ac.uk)
KEYWORDS: East-West studies, Visual Programming, Empirical studies
Like any new research area, the study of graphical programming began broadly and optimistically, attempting to demonstrate the improvement a particular system provided over the status quo or to argue that `graphics is good' (e.g., Shu, 1988). More recently, research has adopted a finer grain, questioning the validity and relevance of the early claims made for graphical representations and asking more realistic questions about the particular ways in which graphics might be useful (e.g., Petre & Green, 1993).
The work reported here is the first part of a larger project intended to address some of these later concerns in the context of program comprehension and creation. It aims to investigate empirically the fit between different program representations--graphical and textual--and programmers' mental representations of programs. It seeks evidence of performance or strategy differences associated with different representations as a means of gaining insight into whether or not these different representations evoke different mental representations. Do expert programmers achieve a deeper (or quicker or more accurate) understanding of specific types of information (e.g., control flow, data flow, functions, operational details) using one type of formalism rather than another? For example, does graphical representation improve comprehension of dependencies?
Previous work on the design of programming languages has frequently made the claim that no particular notation is universally best; rather, each notational structure makes some kinds of information accessible at the expense of other types. Gilmore and Green (1984) postulated that, across the spectrum of information structures, performance is best when the form of the information required by the question matches the form of the representation, and that performance is impaired when there is a mismatch. This is the "match-mismatch hypothesis". In a parallel but independent line of work, Vessey (1991) investigated the use of tables and graphs for conveying information and for problem-solving. She distinguished between the external problem representation and the representation of the problem solving task. When the types of information emphasized in these two representations match, she asserts, "the problem solver uses processes (and therefore formulates a mental representation) that also emphasize the same type of information. Consequently, the processes the problem solver uses to both act on the representation and to complete the task will match, and the problem-solving process will be facilitated." (p. 221) The match-mismatch hypothesis might well lead us to expect both differences in mental representations for different program representations and differences in performance on tasks differentially suited to the different representations. Hence, by varying tasks, programs, and program representations in an orderly way, we hope to expose evidence about differences in mental representations.
The project will record performance on various tasks by four sizeable contingents of programmers using three styles of representation:
Western professionals
in order to enable well-founded comparisons between:
The programming languages selected for these studies were chosen for both commercial credibility and the underlying model, in order to permit the comparisons of interest. The graphical programming languages we see in the West (e.g., Prograph(TM) (The Gunakara Sun Systems Ltd.), LabView(TM) (National Instruments, Inc.), two that are commercially available) typically use a data flow model, whereas the dominant textual languages (e.g., C) use a control flow model. Research so far comparing graphical and textual languages (e.g., Green & Petre) has not separated effects of introducing graphics from effects associated with the switch to data flow representation.
R-charts
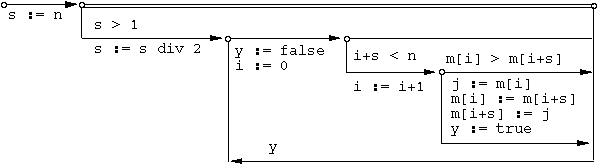
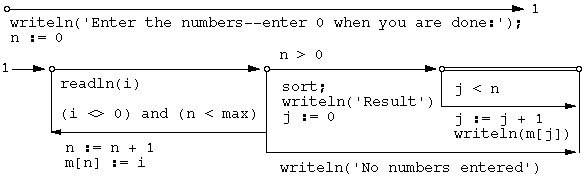
R-charts (McHenry, 1990) are a graphical control-flow based notation which, although largely unknown in the West, has been in use by professionals in the East for over a decade and has had time to expand and evolve into a full graphical programming environment and culture, with several conferences devoted to it exclusively. In 1989 it was adopted by the International Standards Organization as an international standard (ISO/IEC, 1989). The R-chart graphical programming environment was developed at the Glushkov Institute of Cybernetics (the department is now in Technosoft) in Kiev. R-charts are essentially a graphical superstructure, using labeled, directed graphs to express the control logic of a variety of procedural programming languages [Compare Figures 1 and 2]. Current implementations accommodate C, Fortran, Pascal, Modula-2, PL/1, and Cobol with commercial versions available for IBM PC-compatible computers. R-charts evolved from a table-based language developed before the proliferation of graphics terminals and so has a limited graphical repertoire, but nevertheless provides visual cueing of control flow.
Prograph
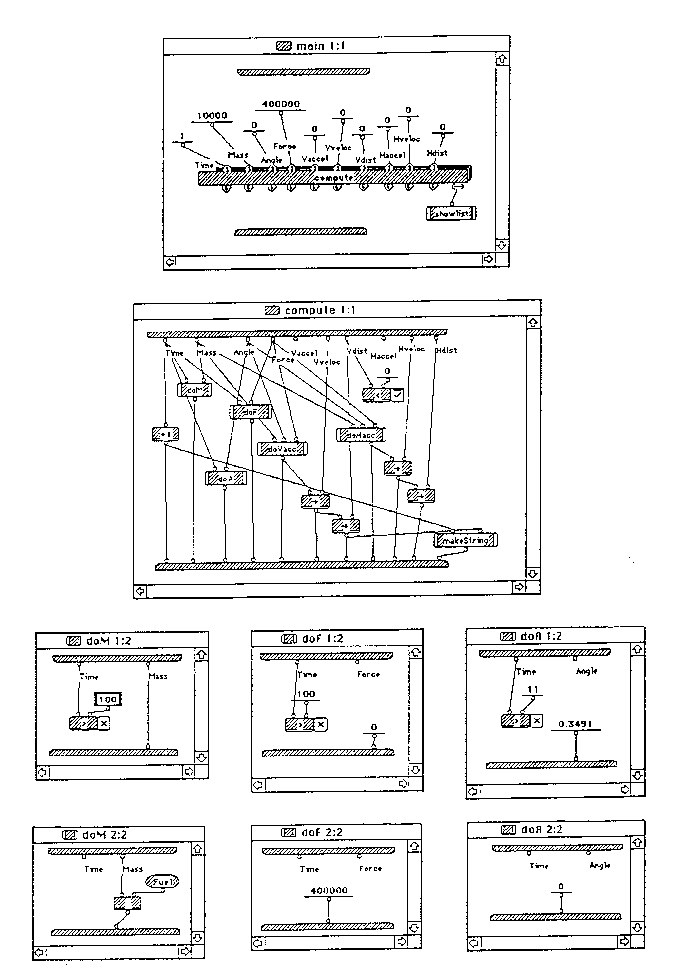
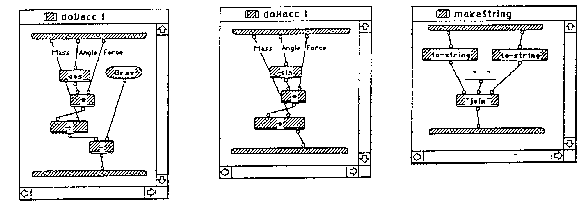
Prograph is a graphical data-flow based language with a quickly expanding professional usership, with the latest versions of the language specifically designed to support professional use. ProGraph is a boxes-and-lines style graphical language with an object-oriented structure, with `methods' (subroutines) connected by the usual lines, carrying data objects from top to bottom of the screen [Figure 3]. Each method may have several cases, with a conditional choosing between them. The `methods' and their cases are each realised as a separate window. ProGraph, like R-charts, has a limited graphical repertoire, because encapsulating code in individual windows limits layout potential, and because the symbols used are nearly all rectangle variants, limiting perceptual cueing. Nevertheless, it does provide visual cueing of data flow.
The project is planned in two stages. The first investigates comprehension of two small programs using (a) a series of questions answered from memory, as well as (b) questions answered with the program in hand. The second stage investigates comprehension of a larger program using a modification task and investigates early program creation. The table characterizes the two stages.
Stage 1                                 Stage 2
investigates comprehension              investigates comprehension and creation

question answering and modification     modification and creation tasks

memory-based and display based tasks    display-based tasks

small programs                          large program

quantitative and qualitative data       qualitative data
Each stage will proceed in two phases, one for the Eastern contingents (R-chart and C programmers) and one for the Western contingents (Prograph and C programmers). So far, we have conducted the Stage 1 experiment in Kiev with the Eastern contingents. This paper reports preliminary results of that experiment .
The first stage of comprehension studies builds on previous work by Fix, Wiedenbeck and Scholtz (1993) which interpreted performance differences between novices and professionals as clues to differences in their mental representations of programs. They characterized experts' mental representations as:
Our research seeks to generalize that characterization by evaluating which aspects of two graphical notations, one control flow (R-charts) and one data-flow (ProGraph), are congruent with it. It expands on the same experiment design (i.e., program study followed by comprehension questions):
Subjects
26 programmers in Kiev participated, all of them experienced C programmers, and 13 of them experienced R-chart programmers as well. Although most have been programming longer than they have been professionals, all have 1 to 20 years of professional experience, with most having more than 5 years, and more than half having more than 10 years. They admitted to knowing 2 to 9 programming languages, including: assemblers (various), Algol, Basic, C, C++, Clipper, Fortran, Foxpro, Lisp, Ops 5 / Ops 11, Prolog, PL/1, Pascal. All are familiar with the sorts of yes/no and multiple choice tests we administered, and all were highly motivated in this set of tasks.
Programs
The programs were a simple program to record student grades and a rudimentary text editor. The grading program was a C translation of the program used by Fix, Wiedenbeck and Scholtz. The memory-based comprehension questions were yes/no versions of those used by Fix, Wiedenbeck, and Scholtz. They required recalling information about different objects or relations in the programs, and they were designed to demonstrate whether the abstract characteristics identified earlier were exhibited in the programmers' mental representations. The switch to yes/no format from fill-in-the-blank was made to reduce the translation burden.
Tests
In order to provide a stronger `baseline' for determining whether the contingents of programmers were genuinely comparable, three written skills tests were administered: the paper folding test for spatial reasoning (20 questions); a C test which tested understanding of C syntax and usage (15 questions); and a general programming test, drawn from the Educational Testing Service's Graduate Record Examination (GRE) for Computer Science, normally administered to university graduates in North America (11 questions).
Protocol
The experiment took roughly 3-1/2 hours per subject, with the parts ordered as follows:
Subjects were instructed to study the program in detail, preparatory to answering questions about its structure and function. They were given scratch paper for notes. Each segment of the experiment was timed. This was to allow sufficient time for the tasks, as determined in pilot studies, but to promote progress. After the study period, subjects were asked if they had read the whole program and if they were satisfied that they were prepared to answer questions. Subjects were asked to rate the confidence of their yes/no responses. The three follow-up questions, for which subjects were permitted to refer to the programs and to their notes, were:
These follow-up interviews were recorded, and note was made of how the materials were handled, which materials the subjects referred to, and which gestures were used. The R-charts contingent received an R-chart version of the first program (whether grading or editor) and a C version of the second program. The C-only contingent received C versions of both. Hence, the experiment was balanced for program order, but not for representation order.
The experiment was run recently and the statistical analysis is not yet complete. However, early analysis suggests some preliminary observations.
First impressions
Overall, comparing observations in this study to our previous observations during other projects of Western professional programmers, our first impression is that programmers from East and West are more similar than different: "programmers are programmers are programmers". The Ukranian programmers recognize tell-tale programming styles (e.g., "This looks like it was written in Pascal." and "This is a very simple text editor program probably written by a Unix hacker."). They make the same complaints. (e.g., "Who chose these labels?") They tell the same jokes. (e.g., "I haven't seen K&R-style code like this in years--how old is this programmer?") However, a proper comparison awaits the participation of the Western contingents.
Ability tests
The skills tests were introduced primarily as a way of assessing the comparability of the different programmer contingents, particularly to ensure clarity in the East-West comparisons. Similarly, the C-only contingents were included as a way either of exposing cultural differences, or of establishing programming culture comparability. The background questionnaire provides additional information about experience, both in years and in languages.
Secondarily, the skills tests might be expected to correlate to programmer experience or to performance. There does not appear to be any convincing set of programming skills tests available generally--the commercially available tests which claim to be well-founded and predictive are proprietary--and so we assembled this short trio of tests to provide information about different contributory skills. Therefore, although it was plausible that the skills tests skills tests would be predictive of performance, there was no firm expectation. Indeed, a preliminary, non-statistical look suggests that there is no obvious correlation between any of our skills tests and performance, nor between our skills tests and experience.
Match-mismatch
Performance on control flow questions appears slightly better than on data flow questions, which follows the match-mismatch hypothesis, since both R-charts and C are control flow representations.
Order
There appears to be a small order or practice effect:
R-charts v. C
Performance between R-charts and C-only groups was not identical. Although performance on the editor program was always worse than performance on the grading program, the discrepancy in performance on the two programs was smaller for the R-chart group. That is, the R-chart group performed slightly worse on the grading program (the simpler one) than the C-only programmers did, and slightly better on the editor program (the more complex).
However, the R-chart contingent is more experienced than the C-only contingent; it included programmers who helped to develop R-charts and who have been programming professionally for 18 to 20 years. Because the assignment to contingents was not within our control, we could not balance the groups within this phase of the experiment. However, we can hope to resolve the confounding when we have data from the Western contingent, which will include more experienced C programmers. We simply remark here that, whether the difference is sustained or not, it will be of interest--if sustained, it will suggest that R-charts can facilitate understanding of more complex control flow; whereas if the performance difference is not sustained it will suggest that experience has a significant role even at this level.
Scale
Performance on the editor program was significantly worse than performance on the grading program.
The two programs differed in both size (88 lines over 3 pages for the grading program versus 109 lines over 4 pages for the main editor program, with additional code covering I/O) and complexity (i.e., number and call structure of functions). The grading program is essentially linear, with no function called more than once. Nevertheless, they are both tiny programs compared to `real-world' practice, and, having allowed 50% more time both for study and for questions for the editor program (an allowance based on experience in the pilot studies), we expected comparable performance on the questions. Nevertheless, the performance was obviously worse, in all categories of question.
We asked subjects to rate the confidence of their responses to the yes/no questions--confident answer, plausible answer, guess--and to use a confident-answers-first completion strategy. They found this liberating, given the time constraints. Responses for the grading program are much more confident, and many fewer questions are skipped. (We have not yet analysed whether these confidence ratings correlate with accuracy.)
The apparent impact of scale, then, even with such small programs, was:
English proficiency side-effect
Despite the subjective similarity of these Eastern programmer contingents to Western programmers, and although we do not yet have the data necessary for the intended East-West comparison, an important cultural issue did arise. It appears that lack of English proficiency had an impact on performance.
Most of the programmers had good English proficiency, which our British colleagues judged by ear and by the programmers' English experience. Our Ukranian colleagues elected not to translate identifier names when they prepared the Russian language materials, reasoning that the programmers are used to dealing with English text, and that the program code was in English in any case. Subjects were provided with a translation sheet, and we noted which of them used it. Few did.
Those with poor English had weaker performance--however, that effect appeared to be mitigated by experience. So, those without English fared badly, but, within that group, those with great experience fared less badly. We might speculate that poor English meant that the labels were not meaningful and so did not assist comprehension. We might speculate further that experience allowed programmers to recognize program structure and meaning with less reliance on labels--perhaps by drawing on other clues such as familiar basic patterns in the code, in keeping with Fix, Wiedenbeck and Scholtz's characterization.
This result not only has implications for non-English programming and transfer of code between countries and languages, but may generalize in two important ways:
1. dealing across domain cultures that have specialist vocabularies, and
2. resonating with research on meaningful naming and naming strategies (e.g., Carroll et al.)
This paper reports preliminary observations from the first phase of a two-stage study comparing performance by professional programmers using different representations to perform comprehension, modification, and creation tasks. The research project is not complete, yet interesting results have already emerged.
We know of no other study that compares East and West programming cultures. The repetition of the Stage 1 protocol with the Western contingents will provide a firm basis for such a comparison. Although, anecdotally, performance by Eastern programmers appears comparable to the more often researched performance of Western programmers, it may be that these studies will reveal particular differences, and that their identification will provide new insight into how programmers program and will ease future collaboration between cultures.
Similarly, we know of no other study that attempts to disentangle the differences of control-flow and data-flow from those associated with graphical and textual representation. The collaboration of East and West affords this project the means for comparison via R-charts and access to a population of professional programmers little investigated.
Future work is designed to compensate for some of the inevitable constraints of the Stage 1 studies. Stage 1 relies heavily on memory-based comprehension tasks; Stage 2 will focus on modification and creation tasks using all materials. The experimental context of Stage 1 favours speed and penalizes the slow, methodical programmer, so that it does not necessarily draw the best from the subjects; Stage 2 will involve longer, purposeful study of a single program and so lessen the time pressure and ease the bias in favour of quick performance. Stage 1 uses small, simple programs in an artificial task; Stage 2 will use a program of more realistic scale in a more realistic task. Together, the performance data from the focussed questions of Stage 1 and the strategic data from the qualitative Stage 2 should provide more complete clues to the mental representations associated with the different program representations.
The early results, even though not yet fully analysed, suggest a number of likely observations:
Gilmore, D. J., and Green, T. R. G. (1984) Comprehension and recall of miniature programs. International Journal of Man-Machine Studies, 21, 31-48.
ISO/IEC (1989) Information technology--program constructs and conventions for their representation. International Standard Document No. ISO/IEC 8631. International Organization for Standardization/International Electrotechnical Commission, Geneve.
McHenry, W.K. (1990) R-Technology: a soviet visual programming environment. Journal of Visual Languages and Computing, 1 (2). 199-212.
Petre, M., and Green, T.R.G. (1993) Learning to read graphics: some evidence that `seeing' an information display is an acquired skill. Journal of Visual Languages and Computing. 4 (1). 55-70.
Shu, N. C. (1988) Visual Programming. Van Nostrand Reinhold.
Vessey, I. (1991) Cognitive fit: a theory-based analysis of the graphs versus tables literature. Decision Sciences, 22, 219-240.
(*This Pascal program reads up to 100 non-zero integers from the user, until a zero is typed, then prints the numbers in sorted order.*)

const max = 100;

var	m: array [1..max] of integer,
	i, j, n: integer;

procedure sort;
var	s: integer,
	y: boolean;
begin
	s := n;
	while s > 1 do
		begin
			s := s div 2;
			repeat
				y := false;
				i := 0;
				while i + s < n do
					begin
						i := i + 1;
						if m[i] > m[i+s] then
							begin
								j := m[i];
								m[i] := m[i + s];
								m[i + s] := j;
								y := true;
							end
					end
			until not (y)
		end
end;


label 1;

begin
	writeln('Enter the numbers--enter 0 when you are done:');
	n := 0;
1:	readln(i);
	if (i <> 0) and (n < max) then
		begin
			n := n + 1;
			m[n] := i;
			goto 1;
		end;

	if n > 0 then
		begin
			sort;
			writeln('Sorted:');
			j := 0
			while j < n do
				begin
					j := j +1;
					writeln(m[j]);
				end
		end
	else
		writeln('No numbers entered');
end.
(*This Pascal program reads up to 100 non-zero integers from the user, until a zero is typed, then prints the numbers in sorted order.*) const max = 100; var m: array [1..max] of integer, i, j, n: integer; procedure sort; var s: integer, y: boolean;